NYPD’s interactive crime map shows no real surprises
The NYPD have released an interactive crime map recently, letting you see all the crimes within any date range. Just October alone is overwhelming enough, with countless “spots” covering the area (bigger dot = more incidents):
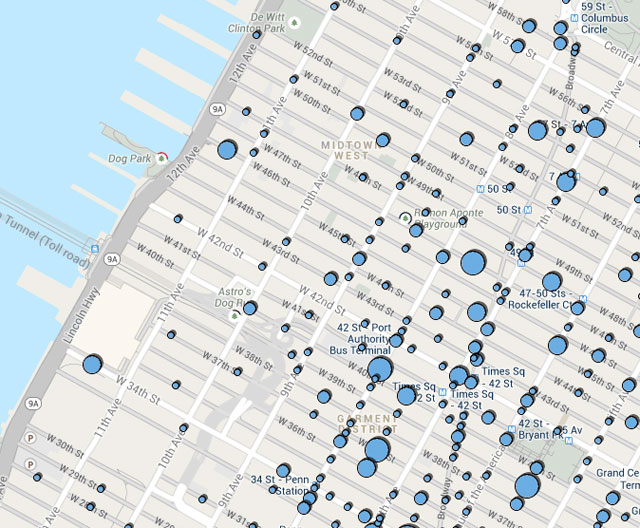
There’s a few notable areas. The 24-hour Megabus, etc, bus stop opposite the Javits Center on W 34th St has a fair few thefts, which isn’t too surprising if you imagine a handful of people standing in poor lighting at 2am on an unpopulated street. Also, outside Port Authority looks like a pretty popular spot for thefts. And there’s your expected Times Square and surrounding areas crime. This is all just October’s stats – if you switch it to the whole year things really get crazy.
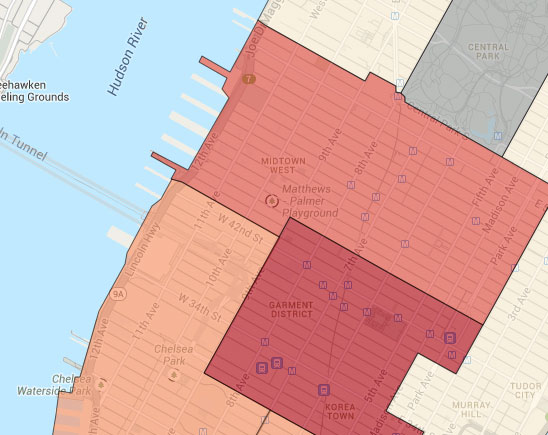
When you look at it on a per-precinct level, you can get a more-general sense of the trends. Unsurprisingly, all around Times Square is the worst rated, which seems to have rippled into the two precincts that cover our neighborhood:
Click through to the map to play around with it yourself, and maybe make yourself never go outside again. (Via Gothamist)